
Nick Bignell

Nick Bignell is the lead service management analyst at UBS. He is responsible for building the reporting and analytics platforms for services provided out of the central back office functions of the bank. By utilising Alteryx and Tableau together he has been able to provide transparency and insight for the UBS business divisions to better manage their costs. Nick also co-leads the London Tableau User Group.
Tableau Public links
Nick Bignell's Data Viz Story
I have been using Tableau since September 2013 and Alteryx since Easter 2015. but the seed for my interest in this field of Data Visualisation started a long time before that. As a kid, I was fascinated by maps, the history of maps and especially the London Underground map, which allows for easy navigation of the Tube's maze of lines.
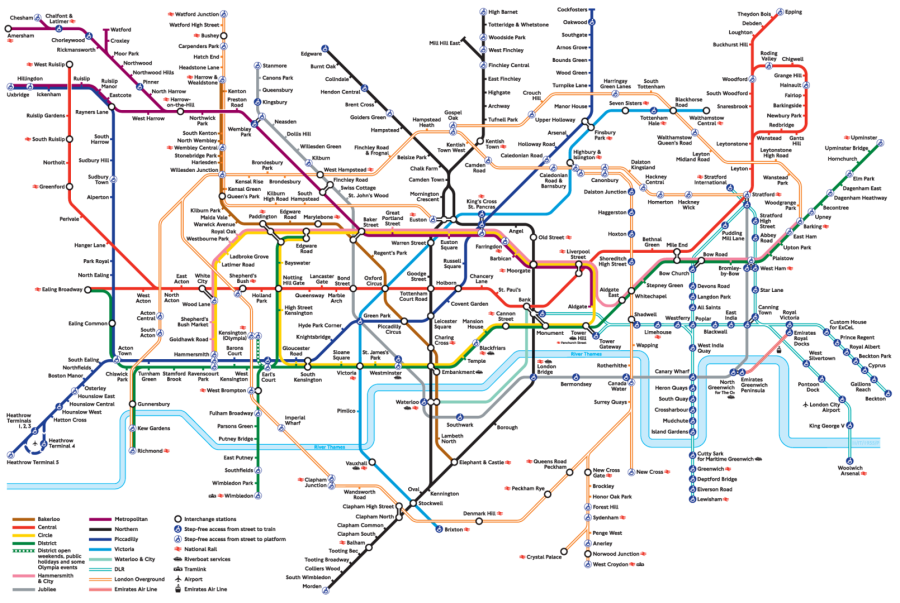
Living in the north London suburb of Mill Hill at the time I had a 4-mile commute across London to my Secondary school in Hendon, options for me getting to school were numerous, including various buses, the Northern Line Tube and Thameslink national railway line. I remember spending hours drawing my own version of the tube map with paper and felt tip pens with all the possible options for getting to school.
More recently, the first foray in to data visualisation came when the bank I have worked for since 2000 UBS, upgraded it Microsoft Office version and Spark lines for each row of a table were possible. I had been using tables in excel to create reports, but this additional visual functionality as part of a table intrigued me. I started looking more at the charting functionality in Excel and was soon producing Reporting packs in PowerPoint using Excel Charts.
However, there was only so much you can do with Excel charts so in September 2013 I started looking for something that would allow me to visualise the data I was reporting better. Tableau was suggested by a colleague Graham Buss. Then a quick look at the internal software store I found that Tableau desktop was available as 14 free trail packages. Now the “Free” bit caught my attention and I requested the install and 10mins later I had it on my desktop ready to go.
First thing I did was watch a few of the excellent introductory videos on the Tableau website. I have to say that I loved the product straight from the start, so much so that over the next two weeks of playing with the tool and producing some really cringe worthy charts with treemaps and bubbles, I started logging improvements I wanted to feed back to tableau. Now remember, I was a long time Excel user and I was trying to get Tableau to do what I had been able to do in Excel (I shudder looking back now).

At the end of the two-week trial I arranged for Paul Banoub to come up to my desk and I went through the 30 “improvements” I though could be made to Tableau. Paul was [looking back] very polite and patent, gently tolling me for each one whether it was on tableau’s roadmap or not…or if it was actually bad practice [about half of them]. This was version 8.1 and I am pleased to say that Tableau have now addressed all of my “real improvements”.
It took a few weeks for my proper tableau licence to come though and I was itching-at-the-bit to get started building all the fabulous dashboards. Teaching myself how to use the tool but also using the excellent tableau training and help pages, as well as the numerous blogs on the internet about how to use the tool, but also about best practice in data visualisation. Soon I was producing reports that were visually stunning [the likes of which my customers had never seen] as we as actually providing business insight in to the data for real business decisions to be made.
I decided then that this path into data visualisation was the thing for me and I threw myself into it. I was lucky in my role that my manager gave me the breathing space to explore this, but he was rewarded many times over by the value add my work was providing.

I started attending the various free events that Tableau and its partners were hosting in London. At one event, there was a London Tableau User Group, then run by Paul Banoub and Paul Chapman. Andy Cotgreave [A truely inspirational role model] was one of the speakers and at the end of it Banoub asked if anyone was interested in joining the TUG leadership team. That night I thought about it and decided that it was an excellent way to get to know this clearly thriving community. The next day I rang Paul up and ask where do I sign…Actually as a TUG Leader you do have to actually sign non-disclosure forms etc…
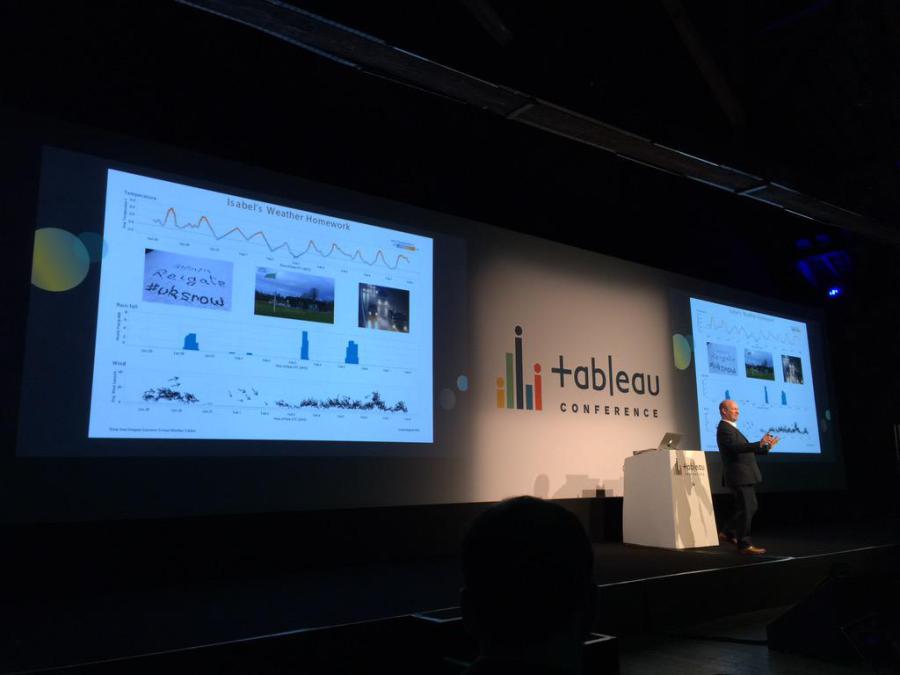
Now I had been to a few of the half and full day events but next was the Tableau Conference on Tour London at The Brewery. This was a totally different scale of Tableau community and as Banoub tells me I had a grin on my face from ear to ear for three days…especially as the first Tableau Public Viz my 7 year old daughter had done for a homework project was up on the big screen during the Opening Keynote from James Eiloart. It was an experience like none I had had before and completely energised me.
As well as hosting a fantastic TUG [Where Francois Ajenstat gave us a scoop on the pre-release Vizable] the customer talks that stand out in my memory are Paul’s Easyjet and UBS talks repectively, both centred round Centres of Excellence but with completely different operating models.
Around the same time as I was getting involved in the User Group, I was also looking for a tool that would help me prepare the data better for Tableau. I had been wrangling with numerous Excel files and had even dabbled with using a MS SQL DB and SSIS. I had heard about Alteryx and also LavaStorm [which had a few users in the bank] but there was no standard for Self-service data preparation. I installed both products and started evaluating them. It was clear from the start that Alteryx had a friendlier user interface [at least for me] and didn’t require any coding [LavaStorm has its own SQL language called BRAIN]. Alteryx can be used by anyone with even a little Excel knowledge, my aim was to learn how to analysis the data quickly not learn a coding language.

Once having proved the value of Alteryx I made it my mission to bring this in to my organisation. Anyone how has done this in a large company will know what a challenge this is, but I kept strong and patient. Eventually I had jumped all the hoops that the company could throw at me and was able to order my first few licenses for my team. This quickly expanded to a few more and before I knew it we were looking at getting Alteryx Server to manage this emerging environment. A load more hoops and many months of effort and I was rewarded with a small server license.

While I was learning to best use Alteryx, Banoub had a series of consultants from The Information Lab to help run his CoE at UBS. Carl Allchin was of particular help and I am eternally grateful to him for his time in answering my dumb questions and being infinitely patient.

It was at this time that Carl told me about an initiative the Information Lab was starting which they were calling the Data School. They would take on keen young people and train them up in Alteryx and Tableau. They had hired Andy Kriebel to lead the training but could pull on the world class skills the information lab has with its core consultants. What was clear having visited the School a couple of times for their regular Friday presentations was that after four months of intensive training they would have a very high skill set and mixed with Andy’s unique teaching style would be confident presenters and communicators. When they are sent out to client’s sites for 3 placements of 6 months each.
The timing was very good for me as my work load was expanding and was given a couple of resources in Krakow, Poland to help. Now at the time, Tableau and especially Alteryx Skills are very rare in Poland, so I had the idea that if I could get one of these data schoolers for their first 6-month placement I could get them to train up my polish team and help me design the Tableau dashboards and Alteryx workflows. And so, started a long relationship and successful with the data school.
The effort I put in to on boarding Alteryx in to UBS seems to have been noticed by the vendor as they sponsored me to give a talk at both the Tableau and Alteryx London conferences in 2016 on this wonderful data visualisation journey.